
PuPHPet is a terrific GUI to set up virtual machines for Web development and will build your orchestration script with Vagrant and Puppet. It now comes with a facility to include XDebug in your Vagrantfile meaning there is no longer an excuse for print_r() and error_log() debug traces in your code.
However, actually getting XDebug configured correctly with the IDE PhpStorm and Chrome browser is fiendishly fiddly, and there are many contradictory articles on the net on how to achieve it. Here is my take on how you shoud set up XDebug, in my case for Drupal development, although of course it'll work on any PHP framework or CMS. My development host is OS X on an ancient 17" Macbook Pro using the free Virtual Box product.
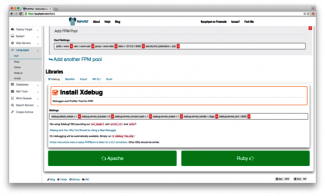
Firstly you should get your virtual machine working. I went for Ubuntu Trusty 64bit, Apache, with PHP 5.4 and most importantly don't forget to check the box for installing XDebug!!!
There are other resources on the Internet for installing VirtualBox, PhpStorm and Vagrant and getting your PuPHPet script up and running, so I won't cover that territory here.
There are three areas you need to configure to get XDebug working: Your Ubuntu virtual machine, your host's copy of PhpStorm, and your Chrome (or in my case Chromium) browser.
[03:10 PM]-[root@local]-[/etc/php5/fpm/conf.d]
# updatedb

[03:10 PM]-[root@local]-[/etc/php5/fpm/conf.d]
# locate xdebug.ini
/etc/php5/cli/conf.d/20-xdebug.ini
/etc/php5/fpm/conf.d/20-xdebug.ini
/etc/php5/mods-available/xdebug.ini
zend_extension="/usr/lib/php5/20121212/xdebug.so"
xdebug.idekey="PHPSTORM"
xdebug.remote_host=10.0.2.15
xdebug.remote_port=100000
xdebug.remote_enable=1
xdebug.remote_autostart=0
xdebug.remote_handler="dbgp"
[03:18 PM]-[root@local]-[/etc/php5/fpm/conf.d]
# locate xdebug.so
/usr/lib/php5/20121212/xdebug.so
[03:21 PM]-[root@local]-[/etc/php5/fpm/conf.d]
# ifconfig
eth0      Link encap:Ethernet  HWaddr 08:00:27:34:6f:30
          inet addr:10.0.2.15  Bcast:10.0.2.255  Mask:255.255.255.0
          inet6 addr: fe80::a00:27ff:fe34:6f30/64 Scope:Link
          UP BROADCAST RUNNING MULTICAST  MTU:1500  Metric:1
          RX packets:60997 errors:0 dropped:0 overruns:0 frame:0
          TX packets:49863 errors:0 dropped:0 overruns:0 carrier:0
          collisions:0 txqueuelen:1000
          RX bytes:8756579 (8.7 MB)  TX bytes:4807502 (4.8 MB)

eth1      Link encap:Ethernet  HWaddr 08:00:27:40:9c:6a
          inet addr:192.168.56.101  Bcast:192.168.56.255  Mask:255.255.255.0
          inet6 addr: fe80::a00:27ff:fe40:9c6a/64 Scope:Link
          UP BROADCAST RUNNING MULTICAST  MTU:1500  Metric:1
          RX packets:127578 errors:0 dropped:0 overruns:0 frame:0
          TX packets:131555 errors:0 dropped:0 overruns:0 carrier:0
          collisions:0 txqueuelen:1000
          RX bytes:21689518 (21.6 MB)  TX bytes:153361934 (153.3 MB)

lo        Link encap:Local Loopback
          inet addr:127.0.0.1  Mask:255.0.0.0
          inet6 addr: ::1/128 Scope:Host
          UP LOOPBACK RUNNING  MTU:65536  Metric:1
          RX packets:100167 errors:0 dropped:0 overruns:0 frame:0
          TX packets:100167 errors:0 dropped:0 overruns:0 carrier:0
          collisions:0 txqueuelen:0
          RX bytes:171493822 (171.4 MB)  TX bytes:171493822 (171.4 MB)
[03:27 PM]-[root@local]-[/var/www/whatsapp-viewer]-[git feature/bulk-operations]
# service apache2 restart
 * Restarting web server apache2                                                                         [ OK ]

[03:27 PM]-[root@local]-[/var/www/whatsapp-viewer]-[git feature/bulk-operations]
# service php5-fpm restart
php5-fpm stop/waiting
php5-fpm start/running, process 24257
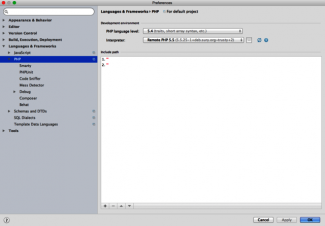
Go to File->Default Settings->Language & Frameworks->PHP and makde sure your Interpreter is set correctly to your VM's PHP interpreter.
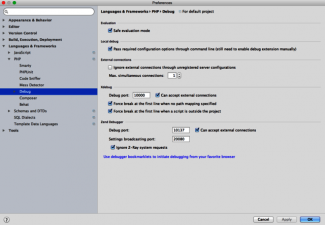
Open up the Debug tab and ensure your settings look like those displayed here - note the port of 10000 matches the value we already put into the xdebug.ini file
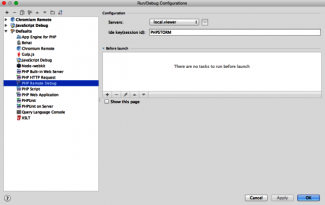
Go to Run->Edit Configurations->Defaults->PHP Remote Debug and ensure that the server is your development domain and the ide key is PHPSTORM as we mentioned before.
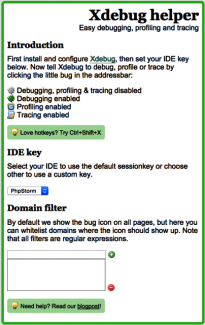
Next you need to be able to switch debugging on and off on your Chrome browser. There are different ways of achieving this but by far the best is by installing the XDebug extension to the browser.
Once the extension has been added made sure the configuration represents PhpStorm
Ok it is now time to check out our configuration. You'll need to enable debugging in your browser, set the listener to on in PhpStorm, and set some breakpoints. Let's show you!
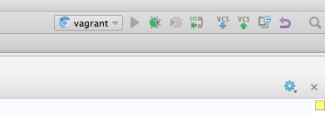
This small image shows the PhpStorm controls in the top right corner. Make sure the fourth icon from the left (represented by a small telephone symbol) is listening for PHP debug connections
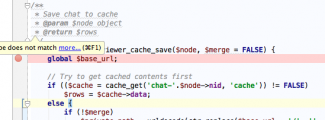
Go to your code and click in the margin to set a breakpoint which will stop the execution so you can inspect variables
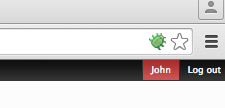
In Chrome make sure you can see the XDebug icon in the far right of the URL bar and it is green and enabled
Navigate around your application in the Chrome browser and once you hit the breakpoint the execution will pause and you will be able to inspect your variables! Success!